
First, pat yourself on the back. I know that looking at reports can be confusing …. and frustrating. There is no shortage of numbers and data to access, the problem is knowing what to do with it.
By completing the RETAILMavens Richer Retailer Vendor Scorecard you are taking action towards a successful season, and improved cash flow, and THAT sets YOU apart from your competition (who is most likely just “winging it”).
You are showing up for yourself, your team, and your customers. And that is something to be proud of!
So let’s take everything you’ve learned from part 1 and part 2 of this series, and tie it all together. As much as the POS data can tell us, it’s still not the whole picture.
What’s missing is a little of that human touch. It’s time to evaluate and take strategic action…

When you look at these numbers representing each vendor, ask yourself if there are any outliers (unusual highs or lows) hiding here?
Evaluate the lows
Hiding in your numbers, was there a bad buy in an otherwise great collection? Maybe one bad product that might skew your numbers negatively?
Evaluate the highs
What was so great about those vendors that performed well?
- Was it a particular color that outperformed?
- Maybe a really popular style that you couldn’t keep in stock?
- A particular weight of yarn?
- A product that was a staff member’s favorite (they will always sell more of their personal favorites)?
Most retailers will skip this last step and only look at the numbers. But that is a BIG mistake! Look, I get it, you are BUSY! There are things to do, I know!
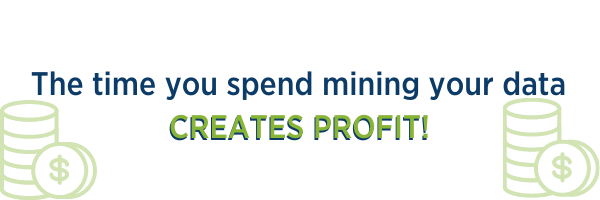
But it’s in evaluating the data that you find the GOLD! The time you spend mining your data actually CREATES profit!
Let me say that again for the people in the back:
Sure, your results might confirm what you already thought you knew. But EVERY TIME, you will learn something that surprises you.