
Are you ready for part 2 in your RETAILMavens Richer Retailer Vendor Scorecard??
I have to tell you, this work gets me really excited- for YOU! Because the eye-opening information it brings can make a huge difference in profitability – and you know More Profit and Better Sleep FOR YOU is my mission!!
This is so much more than a report though! Let’s put it into perspective: By paying attention to the RETAILMavens Vendor Scorecard, you are listening – not just listening, but truly hearing – your customers’ needs and wants.
And by responding to them, you are providing them with an improved customer experience. You are serving them better and you are providing better value.
Think about that for a second.
What do you think that means for your store in the long run?
Yep – serving your tribe better means serving MORE customers and getting MORE sales! Now that we have that next level end result in our mind’s eye, let’s get back to it…
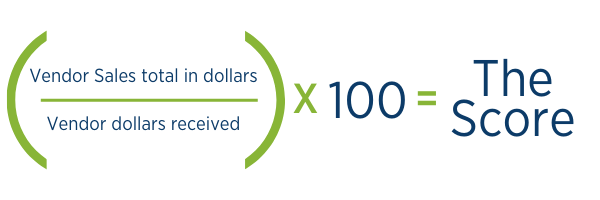
From our work the other day, you should have your total sales by vendor, as well as what percentage each vendor represents of your total sales, from a specific date range – NOT including any major sales events you might have had. For retailers who follow our Clearance Sale Secrets Formula, this would mean from the day after your SACS ends to the day before your next SACS starts.
Now, let’s get the next important numbers from your POS!
I want you to look up how much you received for each vendor during that same time period – but here’s the rub:
We’re using total sales in retail dollars so we must do the same when we look at received dollars. We have to compare apples to apples.
Now do this with each vendor from your POS report.
Way to go! You’re doing it!!
But we’re not quite done yet.
Now you are ready to go to the last step to make your RETAILMavens Vendor Scorecard as accurate as possible.